Our Impact in Numbers
At Beyond Legal Aid, transparency and accountability are at the heart of our work. Here you’ll find our Decade Report, Annual Report, and key data visualizations that highlight our growth, impact, and commitment to community-driven justice.
Explore these resources to see how we’re transforming legal aid alongside our partners and their communities.

Impact Through the Years

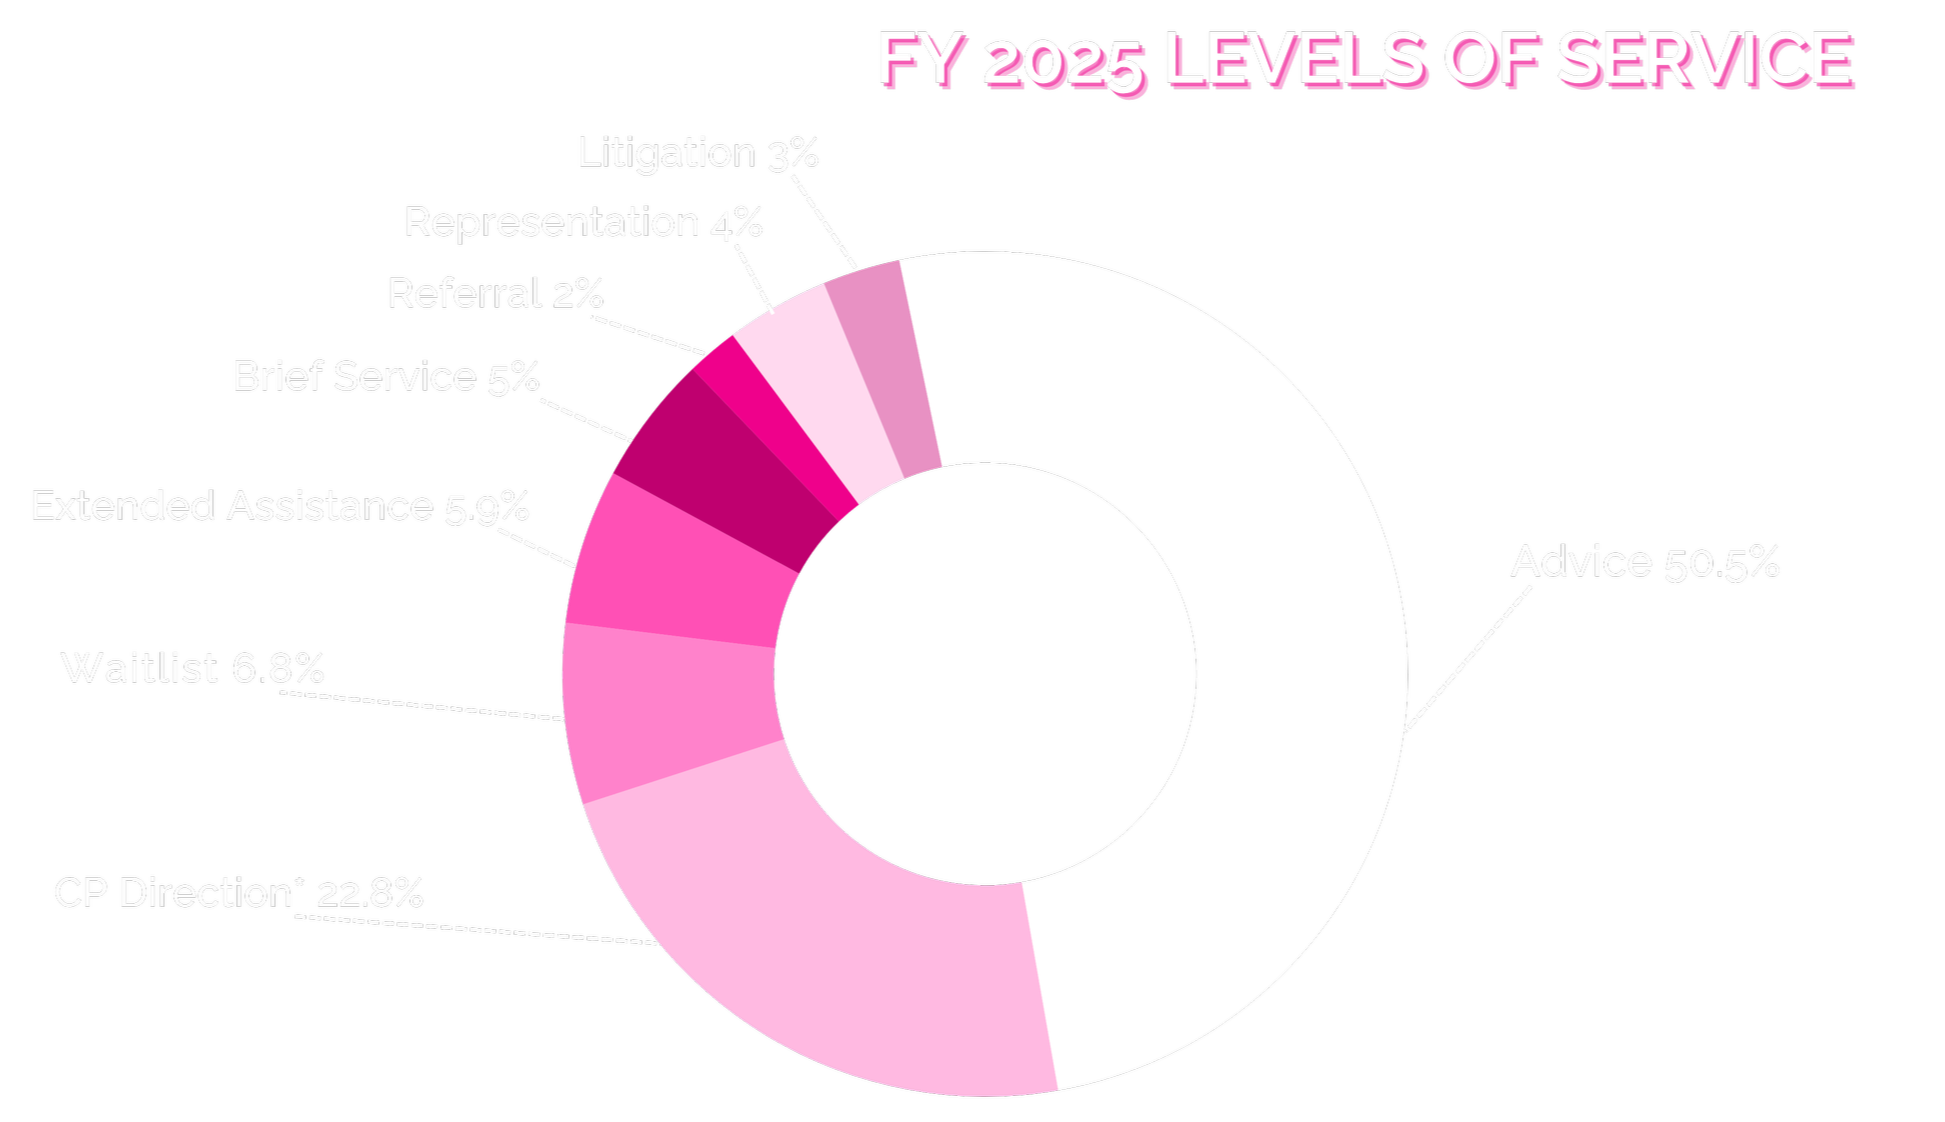
2025

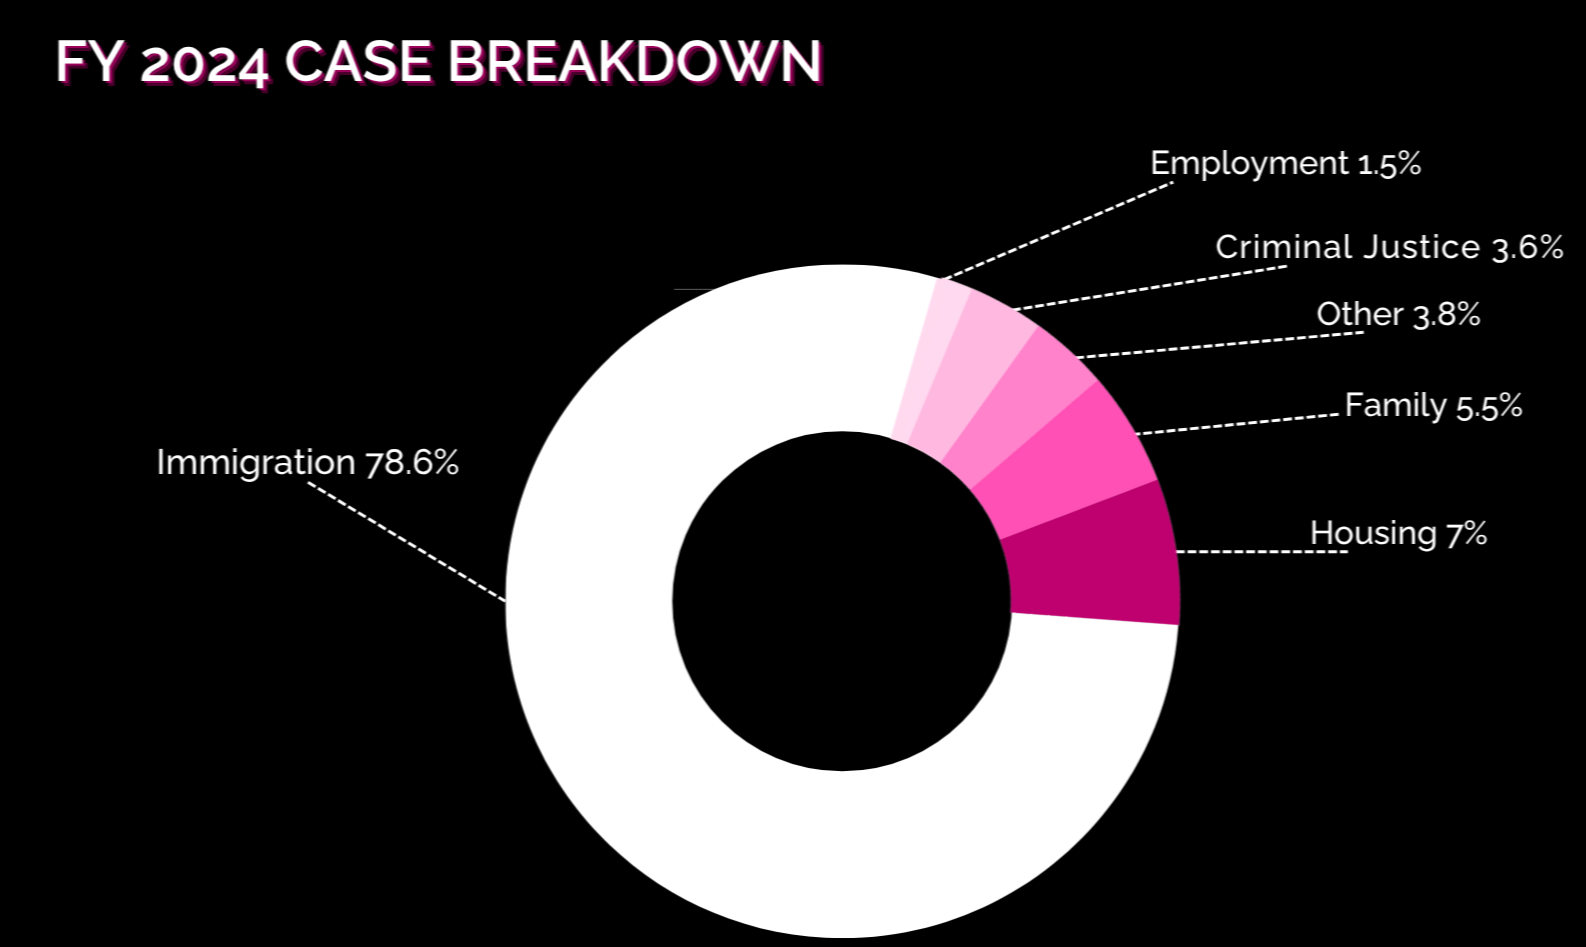
2024